Now that the VIX and More Newsletter has been around for 4 ½ years, I feel less of a need to provide updates on the content, particularly given that I offer a 14-day free trial. Even with the free trial, I get so many questions about the newsletter that it helps to periodically address some of those questions and update potential new subscribers about the manner in which the newsletter is evolving – or – which is the case at present, where the format and content have become somewhat standardized and predictable from week to week.
In looking at the changes in the format and content during 2012, my overall impression is that I have done very little tinkering in recent months. Earlier in the year, when TVIX had issues with its creation units, I switched the +2x VIX ETP focus from TVIX to UVXY and placed some new emphasis on trading TVIX in the context of the TVIX to TVIX.IV (indicative value) ratio.
This year I have also placed more emphasis on approaches to trading VIX options, both long and short, based on reader requests. As many subscribers are not active options traders, I have attempted to segregate the options sections from the more active discussion on trading VIX exchange-traded products. If there has been one area in which the newsletter has dramatically increased its focus over the course of the past year or two, it has been in discussing strategies and trading approaches for the various VIX ETPs.
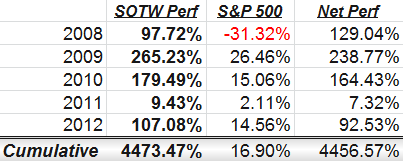
At one point I had three model portfolios and a Stock of the Week ‘Sequential Portfolio’ (SOTW) that I updated each week. Last year I dropped the model portfolios, as they were largely tangential to the primary thrust of the newsletter, but so many readers insisted that the SOTW be retained that I have kept this feature around as kind of a chef’s special dessert. Since I haven’t shared the performance data of the SOTW since early 2011, I thought some might be interested in the numbers. As the table below shows, the Stock of the Week was up 97% in 2008 (based on a March 30, 2008 inception), then surged 265% in 2009, followed that with gains of 179% in 2010, fell off to a gain of 9% in 2011%, and rallied with gains of 107% through the first three quarters of 2012. Through the magic of compounding, this works out to cumulative gains of 4473% since inception, meaning that a $100,000 investment in the Stock of the Week model portfolio strategy in March 2008 would have translated into $4.47 million as of September 30th. For the record, the benchmark S&P 500 index returned 16.9% during the same period. [For a more detailed discussion about the Stock of the Week, start with Newsletter and Portfolio Performance Update Through 12/31/10 and follow the links in that post.]
How do I select the Stock of the Week each week? Well, the methodology has changed over the years. At the beginning my intent was merely to highlight a relatively unknown stock that I thought had a much better than average chance to be a strong short-term and long-term performer. For this reason, I began largely with small caps and never intended on repeating the mention of any stock. Now that I have 237 SOTW selections behind me and a number of larger investors who are interested in more liquid large cap names, I have tweaked the methodology to favor larger issues and to focus more on technical than fundamental criteria. While I still want to emphasize long-term potential, over the course of the past 2-3 years the short-term upside potential has become much more important, as the SOTW performance legacy now has me aiming for a very high bar (something like +100% per year) in order to keep pace with the numbers established in previous years. Since the inception I have run four different stock screens each week and combined the results with my sector analysis and overall market analysis to generate a half dozen or so finalists. From the group of finalists, I scrutinize fundamental and technical data in detail in order to come up with the ultimate selection. For the third quarter of 2012, the selections were dominated by biotechnology/pharmaceuticals (AMGN, PDLI, GILD and MRK), oil and gas refiners (HFC, VLO, TSO and ALJ) and regional banks (BBT, RF).
Going forward, I anticipate that analyzing volatility and trading VIX ETPs and other volatility-centric products will continue to be the main focus of the newsletter, but I will also continue to discuss trading opportunities across all types of asset classes, weigh in on geopolitical and macroeconomic issues, and provide a broad-based framework for structuring a portfolio to take advantage of the opportunities in a world of growing complexity and an investment universe whose opportunities grow in proportion to that complexity.
For those seeking additional information on the newsletter, I am offering a 14-day free trial (see top of right column) to the subscriber newsletter for all new subscribers. Additionally, for those who may be exclusively interested in trading VIX ETPs, my VIX and More EVALS (ETP Volatility Analysis Long-Short) model portfolio service is certainly worth investigating.
Related posts:
- Changes to Newsletter Place More Emphasis on VIX Exchange-Traded Products
- Highlighting Newsletter Content Focus with Content Pyramid
- Newsletter and Portfolio Performance Update Through 12/31/10 (includes a discussion of the Stock of the Week)
Disclosure(s): long GILD and PDLI, neutral position in UVXY via options at time of writing