Tuesday, October 26, 2010

Newsletter and Portfolio Performance Update Through 9/30/10

During the third quarter of 2010 I made two important changes to the subscriber newsletter.

The first change is relatively straightforward. Acting on quite a few requests for more analysis VXX, I added my proprietary VIX Futures Contango Index to the Volatility Update table I publish each week in the recurring Volatility Corner section of the newsletter. Each week I now review the VIX futures, the VIX Futures Contango index and the VXX roll yield in the context of their impact on VXX and other volatility products.

The more substantial change involves changes to the Focus Growth 2 model portfolio. After two years of disappointing performance, I decided to revamp both the stock selection rules as well as the position management algorithms. The changes result in a model portfolio that places increased emphasis on greater long-term growth potential and recent earnings growth, as well as an attractive valuation and volatility profile. The net result is a model portfolio that more closely resembles another portfolio I have been managing in real time for five years that has an average annual return of 39%. It is my intent not to jettison this underperforming model portfolio, but rather to accept the challenge to work to make it a benchmark-beating performer, just as the other two model portfolios have been.

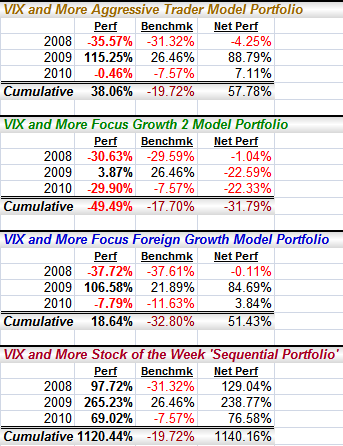
This brings me to the performance data below. All three of the model portfolios topped their benchmarks during the quarter, with the changes to Growth 2 responsible for about a 3% advantage over the benchmark S&P 500 index during the last month of the quarter.

Every time I post this data, invariably the big story becomes the Stock of the Week ‘Sequential Portfolio’ (SOTW) and its 91% gain for the first three quarters of 2010 and 1281% gain since its March 30, 2008 inception. I should probably reiterate what I said last quarter, notably that Michael Stokes of MarketSci had a three-part series in which he reviewed the SOTW, first as a single stock portfolio, then using a short SPY position to hedge market risk and finally examining a theoretical 10-week holding period. The quick summary of MarketSci’s findings is that the performance of the SOTW is very strong both unhedged and hedged, but there is not convincing evidence of persistent outperformance past the initial post-selection week.

The full set of MarketSci reviews can be found at:
For the record, MarketSci’s analysis assumes that an investor would buy the SOTW at beginning of the first session of the following week and close out the position at the end of the final trading day of that week. As I stated in MarketSci on the Stock of the Week ‘Sequential Portfolio’:
“This is different from the Friday close to Friday close data I have always reported in my subscriber newsletter, because I always wanted to report a cost basis in the newsletter on Sunday and assumed that if I avoided stocks which had news over the weekend, the difference between using a Friday close vs. a Monday open as a cost basis would not be meaningful in the long run.”
For those seeking additional information, I am offering a 14-day free trial (see top of right column) to the subscriber newsletter for all new subscribers.


Disclosure(s): short VXX at time of writing

Friday, September 24, 2010

Newsletter and Portfolio Performance Update Through 6/30/10

Largely as a result of overwhelmingly positive feedback, I made no significant changes to the subscriber newsletter during the second quarter of 2010. After two years of tinkering and considerable reader input, the sections, graphics and commentary seem to have found a flow and style that I enjoy and readers appear to be getting a great deal of value from the current structure and format as well.

One interesting development that occurred during the quarter was a review of the Stock of the Week ‘Sequential Portfolio’ (SOTW) by Michael Stokes of MarketSci. In a three-part series, MarketSci has a very positive review of the SOTW, first as a single stock portfolio, then using a short SPY position to hedge market risk and finally examining a theoretical 10-week holding period. The quick summary of MarketSci’s findings is that the performance of the SOTW is very strong both unhedged and hedged, but there is not convincing evidence of persistent outperformance past the initial post-selection week.

The full set of MarketSci reviews can be found at:
For the record, MarketSci’s analysis assumes that an investor would buy the SOTW at beginning of the first session of the following week and close out the position at the end of the final trading day of that week. As I stated in MarketSci on the Stock of the Week ‘Sequential Portfolio’:
“This is different from the Friday close to Friday close data I have always reported in my subscriber newsletter, because I always wanted to report a cost basis in the newsletter on Sunday and assumed that if I avoided stocks which had news over the weekend, the difference between using a Friday close vs. a Monday open as a cost basis would not be meaningful in the long run.”

Regarding the performance of the SOTW and the model portfolios during the second quarter, it was a mixed bag. The S&P 500 index fell 11.9% from 1169 to 1030 during the quarter, with both the Aggressive Trader Model Portfolio and Growth 2 Model Portfolio underperforming the benchmark, while the Foreign Growth Model Portfolio and the Stock of the Week both outperformed the benchmarks. In fact the SOTW increased its margin on the S&P 500 index from 40% to 69% during the period, riding weekly gains of more than 10% from XRTX, VPHM and PQ.

Last but not least, my apologies for the delay in getting this update posted in a timely basis. Not that much changed in the newsletter during the second quarter, but as there have been a number of important changes in the third quarter, I will do my best to provide another update discussing those changes in two weeks or so.

For those seeking additional information, I am offering a 14-day free trial (see top of right column) to the subscriber newsletter for all new subscribers.


Disclosure(s):
long VPHM at time of writing

Wednesday, April 14, 2010

Newsletter and Portfolio Performance Update for 3/31/10

The newsletter continued to fire on all cylinders for the first quarter of 2010 and it was great to get so much positive feedback.

Most of the recent enhancements were relatively minor. I added a color coded Economic Data Highlights table to summarize the actual and estimated numbers for five different areas of economic activity, as those data points have been critical in painting a picture about the relative health of the economy as of late. I also added entries for the VIX front month and second month futures, as well as the VXX roll yield for the Volatility Update table. Finally, I made some minor enhancements to the proprietary Aggregate Market Sentiment Indicator (AMSI) to better tune some of the bullish and bearish signals to the current signal to noise ratio for volatility, put to call data, market breadth, volume, etc.

The real star of the newsletter continues to be the Stock of the Week ‘Sequential Portfolio,’ which is one (relatively) unknown stock I highlight each week. In terms of performance, the Stock of the Week (SOTW) was a consistent performer in the first quarter, experiencing only three losing weeks and generating a cumulative return of 40.9% for the first quarter. The three biggest gainers were RELL, OFIX and BELM. In fact, BELM was selected one day before the company was bought out for a 29.2% premium over the previous close.

The Aggressive Trader Model Portfolio also had a very strong first quarter. This portfolio, which draws from some of the same approach as is used by the SOTW, managed a 27.8% gain in the first quarter. Also beating its benchmark was the Foreign Growth Model Portfolio, which was up 2.1% during the quarter. The mystery sub-par performance continued for the Growth 2 Model Portfolio, which was down 10.8% in the first quarter and was the only portfolio to underperform its benchmark during during this period.

The graphic below shows the performance of the three model portfolios since inception, with a separate breakout for 2008, 2009 and 2010 (first quarter only) results. Note that the benchmark data are slightly different due to the fact that one of the focus model portfolios (Growth 2) was launched later than the others and another focus model portfolio (Foreign Growth) uses the iShares MSCI EAFE (Europe, Australasia and the Far East) ETF, EFA, for a benchmark instead of the SPX benchmark data used by the other portfolios.

For those who may be interested, I am offering a 14-day free trial (see top of right column) to the subscriber newsletter for all new subscribers.


Disclosure(s): none

Sunday, January 3, 2010

Newsletter and Portfolio Performance Update for 12/31/09

In 2009, I continued to tweak and enhance the subscriber newsletter, but during the last quarter of the year there were no changes to the regular sections of the newsletter, as reader feedback persuaded me that a year of adding new features and graphics had finally resulted in a newsletter that was best left in its current incarnation.

One of the unquestionable success stories of the newsletter has been the excellent performance of the three focus model portfolios and the Stock of the Week ‘Sequential Portfolio’ that consists of one relatively unknown stock which I highlight each week. In terms of performance, two of the three model portfolios (Aggressive Trader and Focus Foreign Growth) ended up with returns of more than 100% for the year. The Stock of the Week was the real star performer, however, racking up gains of 265% for the year, with 10 of the 52 weekly picks logging gains of at least 10% during their week in the sun. The top three weekly gainers were Kirkland’s (KIRK), RINO International (RINO) and last week’s selection, Great Plains Renewable Energy (GPRE).

The graphic below shows the performance of the three model portfolios since inception, with a separate breakout for 2008 and 2009 results. Note that the benchmark data are slightly different due to the fact that one of the focus model portfolios (Growth 2) was launched later than the others and another focus model portfolio (Foreign Growth) uses the iShares MSCI EAFE (Europe, Australasia and the Far East) ETF, EFA, for a benchmark instead of the SPX benchmark data used by the other portfolios.

For those who are interested, I am currently offering a 14-day free trial (see top of right column) to the subscriber newsletter for new subscribers.

Disclosure: none