Sunday, August 2, 2020

VIX and More Newsletter Update as of August 2020

It has been almost four years since I have updated here what I have been doing with the VIX and More subscriber newsletter.  Given all the craziness we have witnessed in the markets this year, this seems like a good time to let potential subscribers know what to expect with the current version of the newsletter, which was launched over twelve years ago on March 29, 2008 and has undergone quite a few tweaks along the way, with most of the changes driven by subscriber feedback.

In its current incarnation, the newsletter averages 12-13 pages and averages about one chart or graphic per page.  The newsletter is emailed to subscribers every Wednesday and has a relatively fixed format, with the following sections:

Market Commentary – I begin each newsletter with a recap of a half dozen or so of what I consider to be the key events of the week.  Here the focus is largely on fundamentals and ranges from geopolitical events to the actions and words of central banks across the globe to economic data or COVID-19 developments or whatever forces are behind the movements in the financial markets.  I will almost always tie in changes in interest rates, commodities, volatility and stocks.  [Includes a graphic of the SPX and VIX]

Volatility Overview – Over time, the newsletter has slowly migrated from a publication that highlighted events in the volatility world and offered analysis and trading ideas to something where volatility, the VIX product space and options are central to the entire narrative.  Here one will find an analysis of what happened in the volatility universe during the week, trends in implied vs. realized volatility, as well as notable changes in volatility across various geographies and asset classes, the VIX ETP space, tail risk, buy-writes, etc.  [Includes multiple graphics comparing the VIX to SPX historical volatility as well as a table of 25 key elements in the volatility landscape]

VIX Futures Term Structure – In addition to explaining past and future movements in the VIX ETPs, the VIX futures term structure highlights upcoming event risk, changes in how investors perceive structural/systemic volatility, seasonal factors and other anomalies.  [Includes one graphic of the VIX futures term structure vs. the past one or two weeks as well as a plot of the relative levels of each VIX futures contract]

Trading Volatility and the Short Vol Index – This section begins by explaining the statistical likelihood that the short-term (e.g., VXX) and mid-term (e.g. VXZ) volatility ETPs will rise or fall in the next two week (the proprietary Short Vol Index), then moves on to a longitudinal study of various options trade ideas published in previous weeks.  These options trade ideas encompass volatility, U.S. and international equities, sectors, geographies, commodities, fixed income and a wide variety of narrowly focused ETPs.  Options trade ideas include spreads, straddles, strangles, backspreads, ratios, synthetic options, condors, butterflies, etc.  The discussion includes new weekly trade ideas and management of existing open trade ideas.  [Typically, there are one or two tables used to monitor open trade ideas, with performance and other relevant data]

Risk Assessment:  Evaluating Relative Risk and Volatility in Asset Classes, Geographies and Sectors – This may be my favorite section to write each week, as it is typically full of insights not easily discoverable elsewhere.  The data comes from an analysis of the relative risk and uncertainty in 75 groups of asset classes, geographies and sectors.  The top five groups with the highest relative risk score as well as the top five groups with the biggest positive change in relative risk over the course of the past week are highlighted, with a brief analysis of the factors that are responsible for elevated relative risk.  Here the hope is to identify everything from areas where risk is overpriced to areas where risk is beginning to trend upward, perhaps as part of an early warning signal.  [Includes one table each for the top five areas of relative risk as well as the top five weekly increases in relative risk]

The Fed – Here I assess the consensus expectations related to the evolution of Fed policy as well as my interpretation of where the Fed is going and why it may diverge from consensus expectations.  I also delve into various speeches and interviews during the week and the implications for changes in Fed policy going forward.  For Fed policy statements and press conferences, the Wednesday publication provides an opportunity for a timely summary and analysis of critical developments that arise from the eight annual FOMC meetings.  [The graphic in this section range from the expected evolution of the fed funds rate to Summary of Economic Projections, aka the “dot plots”]

Featured Chart(s) and Commentary – Each week I include 2-4 charts that highlight subjects I consider to be key themes or data trends in the economy or in areas that are likely to impact the economy and financial markets.  The subject matter ranges from fundamental trends to economic data to market sentiment to political factors or subjects such as COVID-19 data.  Many of the charts make use proprietary indices and research.  Typically, these graphics are key inputs into the next section of the newsletter…

Current Investment Thesis – In many respects, this section is the synthesis of all the sections above.  Here I summarize my short-term tactical thinking about the financial markets as well as offer up an intermediate-term or sometimes long-term perspective on where I believe things are going.  I touch on what is driving my investment thesis, what key milestones lie ahead and how I am positioning myself to take advantage of those opportunities.  I endeavor to make this a make this a wide-ranging investment thesis, incorporating equities, volatility, commodities, fixed income and ETPs from across the asset class spectrum.  I almost always delve into geographies, sectors and factors as well.  While my focus is generally on growth and speculative opportunities, depending upon the state of the markets, I typically also discuss some hedging ideas as well as some income-oriented trade ideas. 

Featured ETP Trade Ideas – New as of June 2019 is a section where I highlight three ETPs, indicate whether a long or short bias makes sense over the course of the next 1-4 week options cycle and briefly summarize my rationale for each trade idea.  I also track performance of these ETP trade ideas in rolling one, two, three and four-week portfolios and I am delighted by the performance of these trade ideas in the first thirteen months since I began publishing this information in this section.  [Includes a performance graphic for rolling one, two, three and four-week portfolios]

For those seeking additional information on the newsletter, I am offering a 14-day free trial (see top of right column) to the subscriber newsletter for all new subscribers.

[Additionally, for those who may be interested exclusively in trading VIX ETPs, my VIX and More EVALS (ETP Volatility Analysis Long-Short) model portfolio service is certainly worth investigating.]

Related posts:

Disclosure(s):  net short VXX at time of writing

Tuesday, January 3, 2017

VIX and More Newsletter Update as of January 2017

Since it has been over three years since I have posted about the VIX and More Subscriber Newsletter, I believe an update for potential new subscribers is long overdue.

First of all, the newsletter is still going strong and will celebrate its nine-year anniversary in April.  Over the years, the content has continued to change and the newsletter has grown as new products have hit the market, global macro issues have exerted a stronger influence on volatility, subscribers have requested new types of content and my research interests have evolved.

In its current format, the newsletter is about twelve pages long and is emailed out every Wednesday evening.  The sections of the newsletter are largely fixed for now and are as follows:
  1. Market Commentary – My recap and analysis of the most important events and numbers impacting the financial markets over the course of the past week, typically including graphs of the SPX, the VIX and at least one market sentiment indicator.
  2. Volatility Overview – A discussion of what happened in the world of volatility during the past week, encompassing historical (realized) volatility as well as implied volatility.  While the main focus is the VIX and other U.S. equity volatility indices, I also discuss VIX ETPs, foreign equity volatility indices, volatility indices across a broader range of asset classes (commodities, currencies, bonds, etc.) and a select group of volatility ratios I monitor closely.  This section includes one graphic of the VIX vs. multiple measures of SPX historical volatility as well as a table covering the performance of 24 of my favorite volatility indices, ETPs and ratios.
  3. VIX Futures Term Structure Here I comment on the VIX futures term structure and discuss the term structure relative to several historical reference points, seasonal factors and other anomalies.  Two separate graphics present the term structure relative to historical data.
  4. Trading Volatility and the +XIV IndexThis is typically the longest section of the newsletter and makes use of my proprietary +XIV Index, translating this index (which has shown a strong predictive ability for VIX ETPs for the next 1-2 weeks) into more actionable trading ideas.  The balance of the section examines new and existing options trade ideas (involving primarily SPX, RUT, VIX, VXX and a handful of highly liquid commodities and equities ETPs), including thoughts on position management and related matters.  Typically, there are one or two tables used to monitor open trade ideas, with performance and other relevant data.
  5. Risk Assessment:  Evaluating Relative Risk and Volatility in Asset Classes, Geographies and Sectors – This section drills down on where some of the risk outliers are across the full universe of asset classes, geographies and sectors.  Here is where one is most likely to find an early warning signal for the next evolving risk area as well as identify areas where risk is overpriced or under priced.  This may be my favorite section to write each week, as it is always topical and helps to put a wide range of current threats and opportunities into perspective, including some analysis of the key drivers of risk in each area.  Each week, three separate graphics highlight the top five areas of highest relative risk in terms of asset classes, geographies and sectors.
  6. Probability of a Third Rate Hike, Based on Fed Funds Futures Data – This section was inspired by the 2013 “Taper Tantrum” following Ben Bernanke’s first mention of the Fed’s intention of cutting back on monetary stimulus measures.  In this section I translate futures data into forward-looking probabilities and trends, overlay my own thinking and discuss issues related to the Fed, interest rates and central bank policy in general.  There are one or sometimes two graphics related to interest rate expectations here.  (The section title is a lot narrower than the target subject matter.)
  7. Featured Chart(s) and Commentary – The best part about this section is that it gives me an opportunity to drill down on one or more issues that may not fit neatly into any of the other sections.  Typically, there are anywhere from one to four charts covering one or two subjects that range from economic data to market sentiment to political developments, often using making use of my proprietary indices and research to highlight areas of current and evolving importance.  In football parlance, this is where I get to call an audible at the line of scrimmage.
  8. Current Investment Thesis – The flow of the first seven sections typically provides a natural lead-in for my current investment thesis – which is typically a multi-part thesis.  Here I summarize my short-term tactical thinking about the financial markets as well as offer up an intermediate-term or sometimes long-term perspective on where I believe things are going.  I touch on what is driving my investment thesis, what key milestones lie ahead and how I am positioning myself to take advantage of those opportunities.  I endeavor to make this a make this a wide-ranging investment thesis, incorporating equities, volatility, ETPs from across the asset class spectrum, as well as geographies and sectors.  While my focus is generally on growth and speculative opportunities, depending upon the state of the markets, I typically also delve into some hedging ideas as well as some income-oriented trade ideas.  Last but not least, each week I offer up a list of my favorite ETP trading ideas and the rationale behind these trades, typically with three new long or short ETP trading ideas added to the list each week. 
Once a year I also formally survey subscribers to get their input on how the newsletter can be improved.  This means that while the general structure and format of the newsletter remains similar from year to year, as market conditions and subscriber input warrant, new sections can crop up at any time and old sections may morph into something different or be dropped altogether.

For those seeking additional information on the newsletter, I am offering a 14-day free trial (see top of right column) to the subscriber newsletter for all new subscribers.

[Additionally, for those who may be interested exclusively in trading VIX ETPs, my VIX and More EVALS (ETP Volatility Analysis Long-Short) model portfolio service is certainly worth investigating.]

Related posts:


Disclosure(s):  none

Monday, August 5, 2013

Newsletter Update, Stock of the Week Performance Data and the Launch of New Investment Management Business

Now just shy of 5 ½ years since it was launched, the VIX and More Newsletter continues to grow and evolve, with an increased emphasis on the volatility landscape, volatility products and related options trades since the beginning of the year. There was a time when investors only cared about the VIX and volatility when it was at elevated levels, but lately there seems to be as much concern about a low VIX as a high VIX and there is even some debate about whether the VIX is an accurate gauge of risk in the financial markets, a theme I address in Guest Columnist at The Striking Price for Barron’s: How to Spot Risk Early.

During the course of 2013, the newsletter has made a number of inroads into new territory, including:

  • One area where the newsletter is always evolving is its coverage of volatility indices that cut across asset classes, geographies and sectors; the recent addition of the CBOE/CBOT 10-year U.S. Treasury Note Volatility Index (VXTYN) to the Volatility Update table and Volatility Overview section of the newsletter is one example of that trend
  • Another enhancement to the Volatility Update table and Volatility Overview section of the newsletter is the use of sparklines to make it easier for readers to visualize where current volatility levels are relative to the range of volatility readings over the course of the past year
  • A third enhancement has been a deliberate effort to focus on a greater number of trade ideas for each issue, to make those trade ideas more specific and less general, and to cast a wider net in terms of asset classes, geographies and sectors for those trade ideas
  • While volatility ETPs and ETPs with an embedded options component continue to be one of the most important focus areas of the newsletter, I have recently made an effort to devote more attention to newer and lesser-known products in the VIX and options ETP space
  • At the same time, I have also begun to include more analysis and discussion of VIX and volatility options trades and have also expanded the options component of the newsletter to incorporate the analysis and discussion of options trades for indices as well as ETPs in non-equity asset classes

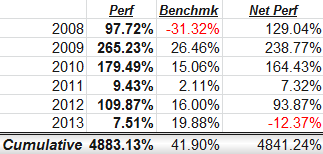
One of the most popular features of the newsletter since its launch has been the Stock of the Week, which has posted head-turning numbers in four of the six years it has been operating. As the table below shows, the performance for the Stock of the Week in 2013 has not lived up to historical standards and I have no particular explanation for why 2011 and 2013 show significantly lower returns than the other four years. Of course, with a single stock ‘portfolio’ whose average weekly change is 5.0% per week, there is necessarily a huge variation in returns, particularly for measurement periods of less than one year.

[source(s): VIX and More]

Please note that as is the case with EVALS performance data, going forward I will no longer be publicly updating Stock of the Week performance data due to a variety of factors related to the launch of my new investment management business. I will continue to offer the newsletter service and the Stock of the Week selection (details below) and will be pleased to discuss current performance data privately. Also, as soon as the launch of my new investment management business is finalized, I will highlight some of the particulars in this space.

[For those seeking additional information on the newsletter, I am offering a 14-day free trial (see top of right column) to the subscriber newsletter for all new subscribers. Additionally, for those who may be interested exclusively in trading VIX ETPs, my VIX and More EVALS (ETP Volatility Analysis Long-Short) model portfolio service is certainly worth investigating.  Feel free to contact me at bill.luby[at]gmail.com for more information about the newsletter or EVALS.]

Related posts:

Disclosure(s): none

Tuesday, January 15, 2013

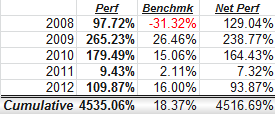
Q4 2012 Newsletter Update, with Stock of the Week +109% for 2012 and +4535% Since Inception

I offered a fairly thorough update of the VIX and More Newsletter about three months ago in my Q3 2012 Newsletter Update, which discussed some of the changes in content and in format that occurred during 2012. In that post, I spent a fair amount of time addressing the refocusing of emphasis on the analysis and trading the VIX ETPs.  Since the primary interest of many newsletter subscribers is trading products like VXX, XIV, UVXY, TVIX, etc., I thought I should talk a little more about four proprietary indices that I chart and discuss each week and that are essential to many of my VIX ETP trading strategies:

  • Roll Yield Index
  • Contango Index
  • Mean Reversion Index
  • +XIV Index

These first three of these indices evaluate the shape of the overall VIX futures term structure and the roll yield at the front end of the curve, then compare these to a VIX prediction model I developed which attempts to anticipate the probability of an upward or downward move in the VIX over the course of the next week, weighted by the potential magnitude of that move. The final index uses the data from the first three indices to evaluate the advisability of being long either XIV or VXX based on the VIX futures term structure and the VIX prediction model for the coming week. The process may seem somewhat complex, but the results have been excellent and after they become familiar with the approach, many subscribers tell me that this Trading Volatility section quickly becomes their favorite part of the newsletter.


Another perennial newsletter favorite  is the Stock of the Week ‘Sequential Portfolio’ (SOTW) that I update each week. In the Q3 2012 Newsletter Update, I offered more details about the stock selection process than I ever have before and I encourage readers who are interested in the mechanics of my SOTW stock selection approach to click on the link above and review what I had to say. Now that 2012 is officially in the books, I can report that the SOTW gained 109.87% in 2012 and ended the year with a cumulative return from the March 30, 2008 inception of +4335%, handily topping the 18.4% return by the S&P 500 index during the same period.


One quirky ‘feature’ of the SOTW performance accounting is that in order to make my record-keeping easier, I have historically used the closing price of the evening the newsletter is published as my cost basis for the SOTW. While this means subscribers who wished to buy at the open on the following morning would rarely have the same cost basis, I have maintained that over the long run, as long as I steer clear of stocks with after-hours news (which I do), any performance differential between using the Wednesday closing price or the Thursday opening price (or Thursday’s VWAP or Thursday’s close or whatever) should not be meaningful. In order to test that theory with 2012 data, I recalculated the SOTW performance for 2012 using the next day’s opening price and determined that the SOTW would have returned 106.19% with that calculation methodology. On 28 of the 52 weeks, the SOTW opened higher on the day following the newsletter than it closed on the day the newsletter was published. Given that the S&P 500 index was up 16% for the year, a slight upside bias is not surprising. The largest close to open price variances were found in CSTR, which appreciated 2.6% by the time it opened the next day, while MVG was down 2.0% when it first traded following the publication of the newsletter.


Also, please note that I am using more and more large capitalization and mega-cap stocks in the SOTW. In the fourth quarter, some of the selections were JPM, F, YHOO, IBN, etc. Some of the third quarter SOTW selections were MRK, AMGN, GILD, BBT, VLO, RF, HFC, TSO, etc.
Going forward, analyzing volatility as well as trading VIX ETPs and other volatility-centric products will continue to be the main focus of the newsletter. That being said, I will also discuss trading opportunities across all types of asset classes, weigh in on geopolitical and macroeconomic issues and provide a broad-based framework for structuring a portfolio to take advantage of the opportunities these present.


For those seeking additional information on the newsletter, I am still offering a 14-day free trial (see top of right column) to the subscriber newsletter for all new subscribers. Additionally, for those who may be interested exclusively in trading VIX ETPs, my VIX and More EVALS (ETP Volatility Analysis Long-Short) model portfolio service is certainly worth investigating.
Related posts:

Disclosure(s):  long XIV, short VXX and UVXY at time of writing

Sunday, October 14, 2012

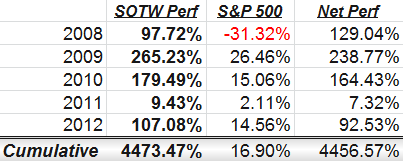
Q3 2012 Newsletter Update, with Stock of the Week +107% YTD and +4473% Since Inception

Now that the VIX and More Newsletter has been around for 4 ½ years, I feel less of a need to provide updates on the content, particularly given that I offer a 14-day free trial. Even with the free trial, I get so many questions about the newsletter that it helps to periodically address some of those questions and update potential new subscribers about the manner in which the newsletter is evolving – or – which is the case at present, where the format and content have become somewhat standardized and predictable from week to week.

In looking at the changes in the format and content during 2012, my overall impression is that I have done very little tinkering in recent months. Earlier in the year, when TVIX had issues with its creation units, I switched the +2x VIX ETP focus from TVIX to UVXY and placed some new emphasis on trading TVIX in the context of the TVIX to TVIX.IV (indicative value) ratio.

This year I have also placed more emphasis on approaches to trading VIX options, both long and short, based on reader requests. As many subscribers are not active options traders, I have attempted to segregate the options sections from the more active discussion on trading VIX exchange-traded products. If there has been one area in which the newsletter has dramatically increased its focus over the course of the past year or two, it has been in discussing strategies and trading approaches for the various VIX ETPs.

At one point I had three model portfolios and a Stock of the Week ‘Sequential Portfolio’ (SOTW) that I updated each week. Last year I dropped the model portfolios, as they were largely tangential to the primary thrust of the newsletter, but so many readers insisted that the SOTW be retained that I have kept this feature around as kind of a chef’s special dessert. Since I haven’t shared the performance data of the SOTW since early 2011, I thought some might be interested in the numbers. As the table below shows, the Stock of the Week was up 97% in 2008 (based on a March 30, 2008 inception), then surged 265% in 2009, followed that with gains of 179% in 2010, fell off to a gain of 9% in 2011%, and rallied with gains of 107% through the first three quarters of 2012. Through the magic of compounding, this works out to cumulative gains of 4473% since inception, meaning that a $100,000 investment in the Stock of the Week model portfolio strategy in March 2008 would have translated into $4.47 million as of September 30th. For the record, the benchmark S&P 500 index returned 16.9% during the same period. [For a more detailed discussion about the Stock of the Week, start with Newsletter and Portfolio Performance Update Through 12/31/10 and follow the links in that post.]

How do I select the Stock of the Week each week? Well, the methodology has changed over the years. At the beginning my intent was merely to highlight a relatively unknown stock that I thought had a much better than average chance to be a strong short-term and long-term performer. For this reason, I began largely with small caps and never intended on repeating the mention of any stock. Now that I have 237 SOTW selections behind me and a number of larger investors who are interested in more liquid large cap names, I have tweaked the methodology to favor larger issues and to focus more on technical than fundamental criteria. While I still want to emphasize long-term potential, over the course of the past 2-3 years the short-term upside potential has become much more important, as the SOTW performance legacy now has me aiming for a very high bar (something like +100% per year) in order to keep pace with the numbers established in previous years. Since the inception I have run four different stock screens each week and combined the results with my sector analysis and overall market analysis to generate a half dozen or so finalists. From the group of finalists, I scrutinize fundamental and technical data in detail in order to come up with the ultimate selection. For the third quarter of 2012, the selections were dominated by biotechnology/pharmaceuticals (AMGN, PDLI, GILD and MRK), oil and gas refiners (HFC, VLO, TSO and ALJ) and regional banks (BBT, RF).

Going forward, I anticipate that analyzing volatility and trading VIX ETPs and other volatility-centric products will continue to be the main focus of the newsletter, but I will also continue to discuss trading opportunities across all types of asset classes, weigh in on geopolitical and macroeconomic issues, and provide a broad-based framework for structuring a portfolio to take advantage of the opportunities in a world of growing complexity and an investment universe whose opportunities grow in proportion to that complexity.

For those seeking additional information on the newsletter, I am offering a 14-day free trial (see top of right column) to the subscriber newsletter for all new subscribers. Additionally, for those who may be exclusively interested in trading VIX ETPs, my VIX and More EVALS (ETP Volatility Analysis Long-Short) model portfolio service is certainly worth investigating.

Related posts:

Disclosure(s): long GILD and PDLI, neutral position in UVXY via options at time of writing

Friday, March 16, 2012

VIX and More Subscriber Newsletter Prices to Increase as of March 31, 2012

Effective March 31, 2012, as the VIX and More subscriber newsletter begins its fifth year, there will be an increase in price from $30/month to $40/month and from $300/year to $400/year.

This is the first time I have raised the price since the launch of the newsletter. Part of the reason for the price increase is that since last July I have been sharing more specific and actionable trading ideas. The newsletter has been significantly underpriced since it was launched – and the upcoming price change is a small acknowledgement of that fact. The good news is that any existing subscriber – monthly or annual – can lock in the current $300/year price by extending their subscription term for an additional year at any time through the end of March.

I have received some questions about how to switch from a monthly to an annual subscription, so for those who may be interested, the easiest way to convert from a monthly to an annual subscription is to:

1)  Cancel existing monthly subscription by clicking on the “Cancel a Subscription – Unsubscribe” button that is just below the CBOE ad and just above the blog archive section on the right column. (I will manually add whatever time remains on your monthly subscription to your new annual subscription.)

2) Begin a new annual subscription by clicking on the Annual Subscription button on the upper section of the same right column 

For those who have an existing annual subscription and wish to extend their term for another year at the current $300/year rate, just follow the instructions for beginning a new annual subscription above.

If you have a problem with canceling your monthly subscription, just let me know and I will do it for you. PayPal will not allow me to add a new subscription for anyone or modify the terms of an existing subscription agreement.

Last but not least, for those who are not yet subscribers and might be interested in locking in the current rates for a full year, this would be a good time to take advantage of the 14-day free trial (see top of right column) and switch to an annual subscription by the end of the month.

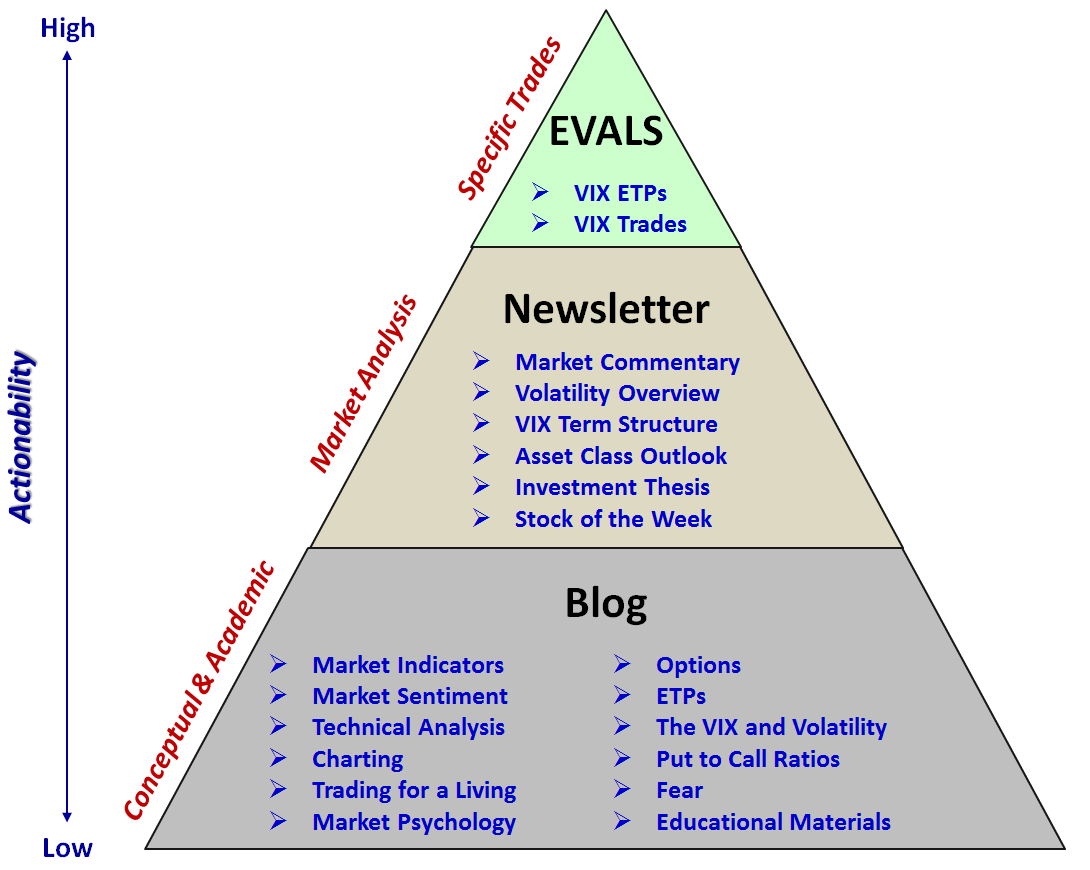
Highlighting Newsletter Content Focus with Content Pyramid

I periodically receive questions about what is included in the subscriber newsletter that is not available on the blog or in EVALS (ETP Volatility Analysis Long/Short, which is essentially a model portfolio.)

In prior posts in this space I have addressed the evolution of the content in the newsletter and described the rationale behind the changes I have made, most of which were prompted by requests from readers. The most recent changes, which I detailed in December in Changes to Newsletter Place More Emphasis on VIX Exchange-Traded Products, involve a shift in emphasis in the direction of the increasingly popular VIX-based exchange-traded products such as VXX, VXZ, XIV, TVIX and the like.

As a visual learner, I have always believed that a picture is worth at least 1000 words, so to help to differentiate between what is in the blog, the newsletter and in EVALS, I have reproduced below the content pyramid that original appeared in Five Years of VIX and More on the main blog.  Note that in addition to VIX and More blog, the newsletter and EVALS, I also publish extended research and analysis pieces at Expiring Monthly:  The Option Traders Journal, the details of which I recently shared in Recent Research Projects and Expiring Monthly.

The good news is that for anyone who is unclear about what is in the newsletter and whether it will be of value to their trading, I offer a 14-day free trial (see top of right column) to the subscriber newsletter for all new subscribers.

Disclosure(s): long XIV; short VXX and TVIX at time of writing

Sunday, December 4, 2011

Changes to Newsletter Place More Emphasis on VIX Exchange-Traded Products

Approximately five months ago I conducted a survey of newsletter subscribers and based on that feedback, implemented a number of changes. Specifically, since July I have been placing a much greater emphasis on VIX ETPs and volatility in general in the newsletter. I have also moved the publication date to Wednesdays from Sundays.

To set the context and provide some explanation for those changes, let me offer a brief bit of history.

Background
When I launched the newsletter, in March 2008, it was based on feedback from some readers who were interested in more details about my proprietary research and analysis on volatility and market sentiment. At the same time, another group of readers were more interested in hearing my general market commentary on a regular basis, as well as how I translated my views on the financial markets into specific trading opportunities. Initially I published two newsletters (research and analysis on Wednesdays and general market commentary and specific stock trading ideas on Sunday) and offered both newsletters bundled together as one subscription. While there was a peaceful coexistence of sorts, I felt a little as if I were making gelato on Wednesdays and cannoli on Sundays and while I liked idea of being an ice cream maker and a pastry chef at the same time, things occasionally got a little schizophrenic. As a result, I merged the two newsletters into one newsletter at the end of 2008.

Content Drift Due to New VIX Exchange-Traded Products
With the launch of the first VIX-based exchange-traded products in January 2009, I made a conscious decision to feature the new VIX products prominently. Initially the likes of VXX and VXZ had a mixed reception, but later these found a broad audience and spawned what is now a whole new asset class consisting of 31 volatility ETPs traded in the U.S. As the months have passed and trading volume in the VIX ETPs has risen, the newsletter focus has evolved from approximately 5% of the content related to VIX ETPs to close to 50%.

Reader Survey Results
A large part of the reason for an increased emphasis on VIX ETPs is due to reader feedback. At the beginning of the summer, I elected to survey subscribers to determine what their primary reasons were for subscribing to the newsletter, what content they enjoyed most and what changes they would like to see. The responses clustered around three main points. First and foremost, readers wanted more analysis of VIX ETPs, including trading ideas. Second, readers were interested in my analysis of volatility and more broadly in how that translated into trading opportunities. Third, quite a few readers expressed a desire to return to the Wednesday or “mid-week” publication schedule.

Changes to the Newsletter Implemented in July
As a result of the reader feedback, I made a number of changes in July. First, I changed the publication from Sundays to Wednesdays. Second, I added two new sections to the newsletter:

1) VIX Futures Term Structure – Includes a term structure graph for the current week and previous week, as well as some commentary about any unusual aspects of the term structure or recent changes in the term structure.

2) Trading Volatility – In this section I translate the VIX futures term structure into the relative attractiveness of various positions due to roll yield and the overall shape of the term structure. I also incorporate some analysis of VIX mean reversion and ultimate single out which VIX ETPs I believe are attractive longs and shorts in the current market environment, often incorporating ideas on how these might be traded with options and futures.

I also enhanced third volatility section, formerly known as Volatility Corner and now known as Volatility Overview. This section includes a table of 17 different volatility measures; my discussion and analysis of these volatility measures provides a lead in to the discussion of the VIX futures term structure and various VIX trading opportunities.

As the table below shows, the only section I dropped from the newsletter was the VIX and More Focus Model Portfolios. I also used this opportunity to fold The Week in Review and The Week Ahead into one larger Market Commentary section.

Old VIX and More Newsletter

VIX and More Newsletter Since July

The Week in Review:  What Moved the Markets

Market Commentary (includes a look back and a look ahead)

Market Commentary

The Week Ahead:  What to Look For

Aggregate Market Sentiment Indicator (AMSI)

Aggregate Market Sentiment Indicator (AMSI)

Volatility Corner

Volatility Overview


VIX Futures Term Structure


Trading Volatility

Asset Class Outlook

Asset Class Outlook

Current Investment Thesis

Current Investment Thesis

VIX and More Focus Model Portfolios


The Stock of the Week

The Stock of the Week


EVALS Relaunched, Now Focusing on VIX ETPs
The final change that came from the reader survey was a relaunch of EVALS (ETP Volatility Analysis Long/Short) two weeks ago. Whereas the prior incarnations of the newsletter and EVALS were completely independent of each other, now EVALS, which is a model portfolio consisting almost entirely of VIX ETPs, is a tightly linked complement to the newsletter and specifically extends the analysis of Volatility Overview, VIX Futures Term Structure and Trading Volatility to an actively-traded model portfolio.

Conclusion
For those who find my summary of the changes less than crystal clear, the good news is that I continue to offer a 14-day free trial (see top of right column) to the subscriber newsletter for all new subscribers.

Disclosure(s): long XIV and short VXX at time of writing

Wednesday, March 30, 2011

Newsletter and Portfolio Performance Update Through 12/31/10

Today marks the third anniversary of the VIX and More Newsletter. To be honest, I had no idea what I would be getting in to when I started this venture. The primary impetus for the newsletter came from blog reader who were interested in my thoughts on a broad range of subjects, from the various geopolitical and macroeconomic influences on volatility to a more comprehensive look at market sentiment, to my assessment of some asset classes that I rarely mentioned on the blog, such as commodities (now more prominently featured), bonds and currencies.

Each Sunday I sit down to reflect on the events of the past week and plan out my trading for the coming week. I write the newsletter partly for myself, in order to organize my thinking, and partly for the benefit of readers whose questions and comments have given me a sense of which areas I should emphasize and drill down on.

From the outset I have considered the core of the newsletter to be a discussion of the main influences on the market during the past week, an evaluation of the most important economic data and earnings report scheduled for the coming week and a discussion of my current investment thesis and trading ideas across a broad range of asset classes, sectors, geographies, etc.

As time went on, reader feedback has caused me to place increased emphasis on volatility, including the VIX, various other volatility indices, VIX futures, VIX options and the growing number of VIX ETFs and VIX ETNs. As a result of this feedback, it has been the Volatility Corner section of the newsletter that has seen the most growth in terms of dedicated space and analysis. This trend continued during the fourth quarter, when as a result of the proliferation of volatility-based ETNs and ETFs I expanded the Volatility Update table to include data and analysis of three new VIX ETNs:
  • TVIX -- VelocityShares Daily 2X VIX Short-Term ETN
  • XIV -- VelocityShares Daily Inverse VIX Short-Term ETN
  • XVIX -- UBS E-TRACS Daily Long-Short VIX ETN
I am proud of all the positive feedback I have received along the way and consider the unusually high renewal rate to be a sign that readers are getting a good deal of value out of what I write.  Thanks to those who have been subscribers from the very beginning and those who have offered their support and encouragement along the way.

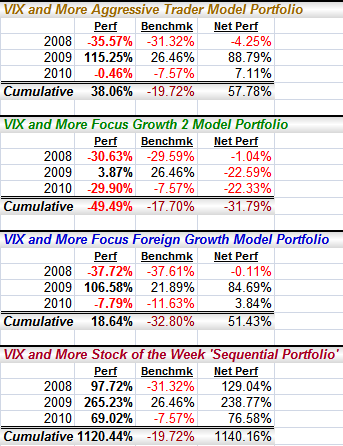
Of course, each quarter I publish performance data for three model portfolios and a Stock of the Week ‘Sequential Portfolio’ (SOTW). During the fourth quarter the model portfolios performed extremely well, racking up substantial gains. Three of the four portfolios topped their benchmarks during the quarter, some of them by huge margins. The sole exception was Focus Foreign Growth, which still managed to top its benchmark (the EAFE index ETF, EFA) by more than 16% for the year.
The one disappointment for 2010 was the Focus Growth 2. As detailed in the post below, I decided to revamp both the stock selection rules as well as the position management algorithms for Growth 2 and implemented those changes on August 30. Since that change, Growth 2 is up 30.8% and is making up ground on the benchmark S&P 500 index.

This brings me to the Stock of the Week ‘Sequential Portfolio’ (SOTW), which has become a rock star of sorts. After returning 97% in 2008 (from the March 30th launch until the end of the year, the SOTW gained 265% in 2009 and followed that up with a gain of 179% in 2010. As I am sure the publication of the numbers for the full year will once again bring in a rash of emails, let me offer up some pre-emptive commentary.

First, I recommend that anyone who is interested in exploring the SOTW in some detail examine the work of Michael Stokes of MarketSci, who had a three-part series in April 2010 in which he reviewed the SOTW, first as a single stock portfolio, then using a short SPY position to hedge market risk and finally examining a theoretical 10-week holding period. The quick summary of MarketSci’s findings is that the performance of the SOTW was very strong both unhedged and hedged, but there is not convincing evidence of persistent outperformance past the initial post-selection week.

The full set of MarketSci reviews can be found at:
For the record, MarketSci’s analysis assumes that an investor would buy the SOTW at beginning of the first session of the following week and close out the position at the end of the final trading day of that week. As I stated in a VIX and More post MarketSci on the Stock of the Week ‘Sequential Portfolio’:
“This is different from the Friday close to Friday close data I have always reported in my subscriber newsletter, because I always wanted to report a cost basis in the newsletter on Sunday and assumed that if I avoided stocks which had news over the weekend, the difference between using a Friday close vs. a Monday open as a cost basis would not be meaningful in the long run.”
Many readers have asked me to provide an analysis of how the SOTW would have performed in 2010 had someone used the SOTW selections to purchase the SOTW at its opening price on the following Monday and sell it at its closing price at the end of the week. I hope to have this information and some additional related analysis published in short order.

For those seeking additional information, I am offering a 14-day free trial (see top of right column) to the subscriber newsletter for all new subscribers.


Disclosure(s): long XIV and short VXX at time of writing

Tuesday, October 26, 2010

Newsletter and Portfolio Performance Update Through 9/30/10

During the third quarter of 2010 I made two important changes to the subscriber newsletter.

The first change is relatively straightforward. Acting on quite a few requests for more analysis VXX, I added my proprietary VIX Futures Contango Index to the Volatility Update table I publish each week in the recurring Volatility Corner section of the newsletter. Each week I now review the VIX futures, the VIX Futures Contango index and the VXX roll yield in the context of their impact on VXX and other volatility products.

The more substantial change involves changes to the Focus Growth 2 model portfolio. After two years of disappointing performance, I decided to revamp both the stock selection rules as well as the position management algorithms. The changes result in a model portfolio that places increased emphasis on greater long-term growth potential and recent earnings growth, as well as an attractive valuation and volatility profile. The net result is a model portfolio that more closely resembles another portfolio I have been managing in real time for five years that has an average annual return of 39%. It is my intent not to jettison this underperforming model portfolio, but rather to accept the challenge to work to make it a benchmark-beating performer, just as the other two model portfolios have been.

This brings me to the performance data below. All three of the model portfolios topped their benchmarks during the quarter, with the changes to Growth 2 responsible for about a 3% advantage over the benchmark S&P 500 index during the last month of the quarter.

Every time I post this data, invariably the big story becomes the Stock of the Week ‘Sequential Portfolio’ (SOTW) and its 91% gain for the first three quarters of 2010 and 1281% gain since its March 30, 2008 inception. I should probably reiterate what I said last quarter, notably that Michael Stokes of MarketSci had a three-part series in which he reviewed the SOTW, first as a single stock portfolio, then using a short SPY position to hedge market risk and finally examining a theoretical 10-week holding period. The quick summary of MarketSci’s findings is that the performance of the SOTW is very strong both unhedged and hedged, but there is not convincing evidence of persistent outperformance past the initial post-selection week.

The full set of MarketSci reviews can be found at:
For the record, MarketSci’s analysis assumes that an investor would buy the SOTW at beginning of the first session of the following week and close out the position at the end of the final trading day of that week. As I stated in MarketSci on the Stock of the Week ‘Sequential Portfolio’:
“This is different from the Friday close to Friday close data I have always reported in my subscriber newsletter, because I always wanted to report a cost basis in the newsletter on Sunday and assumed that if I avoided stocks which had news over the weekend, the difference between using a Friday close vs. a Monday open as a cost basis would not be meaningful in the long run.”
For those seeking additional information, I am offering a 14-day free trial (see top of right column) to the subscriber newsletter for all new subscribers.


Disclosure(s): short VXX at time of writing

Friday, September 24, 2010

Newsletter and Portfolio Performance Update Through 6/30/10

Largely as a result of overwhelmingly positive feedback, I made no significant changes to the subscriber newsletter during the second quarter of 2010. After two years of tinkering and considerable reader input, the sections, graphics and commentary seem to have found a flow and style that I enjoy and readers appear to be getting a great deal of value from the current structure and format as well.

One interesting development that occurred during the quarter was a review of the Stock of the Week ‘Sequential Portfolio’ (SOTW) by Michael Stokes of MarketSci. In a three-part series, MarketSci has a very positive review of the SOTW, first as a single stock portfolio, then using a short SPY position to hedge market risk and finally examining a theoretical 10-week holding period. The quick summary of MarketSci’s findings is that the performance of the SOTW is very strong both unhedged and hedged, but there is not convincing evidence of persistent outperformance past the initial post-selection week.

The full set of MarketSci reviews can be found at:
For the record, MarketSci’s analysis assumes that an investor would buy the SOTW at beginning of the first session of the following week and close out the position at the end of the final trading day of that week. As I stated in MarketSci on the Stock of the Week ‘Sequential Portfolio’:
“This is different from the Friday close to Friday close data I have always reported in my subscriber newsletter, because I always wanted to report a cost basis in the newsletter on Sunday and assumed that if I avoided stocks which had news over the weekend, the difference between using a Friday close vs. a Monday open as a cost basis would not be meaningful in the long run.”

Regarding the performance of the SOTW and the model portfolios during the second quarter, it was a mixed bag. The S&P 500 index fell 11.9% from 1169 to 1030 during the quarter, with both the Aggressive Trader Model Portfolio and Growth 2 Model Portfolio underperforming the benchmark, while the Foreign Growth Model Portfolio and the Stock of the Week both outperformed the benchmarks. In fact the SOTW increased its margin on the S&P 500 index from 40% to 69% during the period, riding weekly gains of more than 10% from XRTX, VPHM and PQ.

Last but not least, my apologies for the delay in getting this update posted in a timely basis. Not that much changed in the newsletter during the second quarter, but as there have been a number of important changes in the third quarter, I will do my best to provide another update discussing those changes in two weeks or so.

For those seeking additional information, I am offering a 14-day free trial (see top of right column) to the subscriber newsletter for all new subscribers.


Disclosure(s):
long VPHM at time of writing

Wednesday, April 14, 2010

Newsletter and Portfolio Performance Update for 3/31/10

The newsletter continued to fire on all cylinders for the first quarter of 2010 and it was great to get so much positive feedback.

Most of the recent enhancements were relatively minor. I added a color coded Economic Data Highlights table to summarize the actual and estimated numbers for five different areas of economic activity, as those data points have been critical in painting a picture about the relative health of the economy as of late. I also added entries for the VIX front month and second month futures, as well as the VXX roll yield for the Volatility Update table. Finally, I made some minor enhancements to the proprietary Aggregate Market Sentiment Indicator (AMSI) to better tune some of the bullish and bearish signals to the current signal to noise ratio for volatility, put to call data, market breadth, volume, etc.

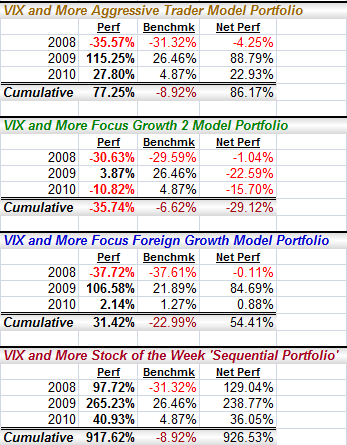
The real star of the newsletter continues to be the Stock of the Week ‘Sequential Portfolio,’ which is one (relatively) unknown stock I highlight each week. In terms of performance, the Stock of the Week (SOTW) was a consistent performer in the first quarter, experiencing only three losing weeks and generating a cumulative return of 40.9% for the first quarter. The three biggest gainers were RELL, OFIX and BELM. In fact, BELM was selected one day before the company was bought out for a 29.2% premium over the previous close.

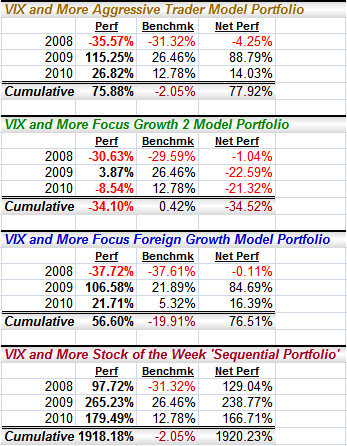
The Aggressive Trader Model Portfolio also had a very strong first quarter. This portfolio, which draws from some of the same approach as is used by the SOTW, managed a 27.8% gain in the first quarter. Also beating its benchmark was the Foreign Growth Model Portfolio, which was up 2.1% during the quarter. The mystery sub-par performance continued for the Growth 2 Model Portfolio, which was down 10.8% in the first quarter and was the only portfolio to underperform its benchmark during during this period.

The graphic below shows the performance of the three model portfolios since inception, with a separate breakout for 2008, 2009 and 2010 (first quarter only) results. Note that the benchmark data are slightly different due to the fact that one of the focus model portfolios (Growth 2) was launched later than the others and another focus model portfolio (Foreign Growth) uses the iShares MSCI EAFE (Europe, Australasia and the Far East) ETF, EFA, for a benchmark instead of the SPX benchmark data used by the other portfolios.

For those who may be interested, I am offering a 14-day free trial (see top of right column) to the subscriber newsletter for all new subscribers.


Disclosure(s): none