Monday, March 30, 2009

One Year Portfolio Performance Update

Now that the subscriber newsletter is available on a free trial basis, I no longer see the need to detail some of the content that is available in the newsletter. The format is essentially unchanged from the beginning of the year, but since I have had several requests to provide quarterly updates of the performance of the VIX and More model portfolios, I will use this space to do just that.

Technically, the first quarter does not end for one more day, but since today is the one year anniversary of the launch of the newsletter, I thought it would be an ideal time to update the portfolio performance data.

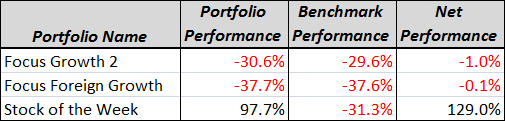
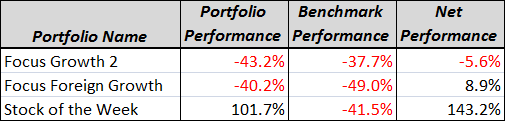
The graphic below shows the 2008 and 2009 performance data for the three VIX and More portfolios. These are long-only portfolios of individual stocks that do not invest in ETFs or options and are rebalanced only on weekends. I call the top two portfolios Focus portfolios because each portfolio is limited to only five stocks. The Focus Growth 2 Model Portfolio was launched on August 31, 2008 and utilizes the S&P 500 index as a benchmark. The Focus Growth 2 portfolio was actually beating the benchmark until last week, when the top holding, DRDGOLD (DROOY), suffered a sharp decline.

The second Focus portfolio, Focus Foreign Growth, has been a standout performer, particularly in 2009. Launched on March 30, 2008 in the initial newsletter, this portfolio has been heavily invested in China in recent weeks, where top holding Shanda Interactive Entertainment (SNDA) has helped propel the portfolio to an 8.8% advantage over the benchmark EAFE (Europe, Australasia and the Far East) Index ETF (EFA).

The big success story has been what I call the Stock of the Week ‘Sequential Portfolio,’ whose name reflects the fact that the ‘portfolio’ consists of only one stock. Each selection is retained in the portfolio for one week only and is automatically replaced the following week, regardless of performance. Also launched on March 30, 2008 in the initial newsletter, the SOTW has gained a remarkable 101.6% during a period in which the benchmark S&P 500 index has declined more than 41%. Some of the top performers in the SOTW have been JDAS (+18.5%), WTI (+15.5%), MAXY (+14.5%), CCOI (+12.3%) and SQM (+11.0).

For those who may be interested, I will update the EVALS performance data tomorrow after the close and then update both these three portfolios and EVALS at the end of each subsequent quarter going forward.

Sunday, March 29, 2009

Announcing Blogger Triple Play

While Direxion 3x ETFs have been a big hit since their launch back in November, deep down I have always thought I could do better. So today I am delighted to announce that VIX and More has joined forces with bloggers extraordinaire Jeff Pietsch of Market Rewind and Rob Hanna of Quantifiable Edges with a new 3x offer, the Blogger Triple Play.

For an annual subscription of $865, the Blogger Triple Play promises a savings of 25% from the combined monthly subscription prices of the three subscriptions if they had been purchased individually.

Included in the package is:

  1. Market Rewind – How does your portfolio stack up to the market? What's working now? Take a deep-dive each night into over 170 ETFs while maintaining a broad perspective over twelve major asset classes with Jeff Pietsch’s ETF Rewind Pro. If that weren't enough, actionable model portfolio ideas, mechanical timing signals, nightly commentary, pairs trading, and custom portfolio correlation and optimization analytics are all included!

  2. Quantifiable Edges – Start your week right with Rob Hanna's Quantifiable Edges Silver Subscription. Understand how recent market action compares historically. Get more detailed research than has ever been provided on the blog. Give yourself and your trading a Quantifiable Edge.

  3. VIX and More – My weekend subscriber letter goes beyond the blog to provide a global overview of what is moving the markets, from geopolitical events to macroeconomic issues and fundamental analysis, along with a detailed assessment of volatility and market sentiment. The newsletter is comprehensive in scope and focuses on all asset classes.

As part of the three-day trial period, you will receive three evening editions of Jeff's ETF Rewind Pro, as well as the most recent weekly subscriber letters from Quantifiable Edges and VIX and More for evaluation.

The annual subscription fee of $865 clears through Market Rewind's secure Paypal site under the Maple Park Management, LLC name. This inaugural pricing will not last! You aren't likely to find a better bargain for as much of a diverse informed edge anywhere else on the web. Why not give it a try?


Note: Each service is subject to the respective author's disclaimers and notices.

Sunday, January 4, 2009

Subscriber Newsletter Features and Portfolio Performance Through December 2008

As I mentioned previously, I continue to make enhancements to the subscriber newsletter. The most important change is that instead of publishing two very different editions on Wednesday and Sunday, I am now combining all the content into one weekly issue, with new content.

Starting with today’s the newsletter, the Market Recap and Commentary section is being expanded into a more comprehensive The Week in Review and separate Market Commentary section. There will be an increased emphasis on a global perspective, macroeconomic issues and fundamental analysis.

Another new section, Volatility Update, tracks and analyze changes in the VIX, the VIX and More Global Volatility Index, the VXV, and a number of related indicators, such as moving averages in the VIX, historical volatility in the SPX, the VIX:VXV ratio, etc.

The new VIX and More Subscriber Newsletter will be published on Sunday evenings going forward, with the following ‘permanent’ sections:

  1. The Week in Review
  2. Market Commentary
  3. The Week Ahead: What to Look For
  4. Market Sentiment (using a proprietary Aggregate Market Sentiment Indicator)
  5. Volatility Update
  6. Asset Class Outlook (short, intermediate, and long-term outlook for ten asset classes)
  7. Weekly Feature(s)
  8. Current Investment Thesis
  9. VIX and More Focus Model Portfolios
  10. Stock of the Week

As the newsletter and the economy are undergoing some dramatic changes, I am now making the newsletter available on a free trial basis. In order to receive a free trial, just click on the “Monthly Subscription: Subscribe” button in the upper right hand corner of the blog and follow the instructions. The free trial lasts for 14 days. Readers who elect not to cancel after the 14 day trial period will be billed at a rate of $30 per month.

Also, as a gesture of appreciation to former subscribers, I will add one free month to any subscriber who chooses to re-subscribe.

In response to reader requests, I will also be creating a detailed glossary to provide background on terms, abbreviations, acronyms and tickers I frequently refer to in the newsletter. The beginnings of this glossary can be found in the post below.

For the record, some of the December features included:

  • 2008 Volatility Highlights and Observations
  • What the VIX Indicates Right Now
  • Equity and Credit Risk Both Dropping Rapidly
  • Housing Prices, Inventory, and Net Worth
  • Strong Divergence Between Investment Grade and High Yield Corporate Bonds
  • VIX Term Structure Shows Changing Evolution of Volatility and Risk Expectations
  • Further Research into the Spread Between the VIX and the Historical Volatility of the SPX
  • A Closer Look at VIX and SPX Divergences
  • Week By Week Asset Class Year in Review
  • Financials Lagging, Consumer Discretionary Stocks Leading
  • Options Expiration Income Strategy
  • A Buy-Write Strategy Approach
  • New Feature: Volatility Update
  • Sector Strength in the Recent Rally

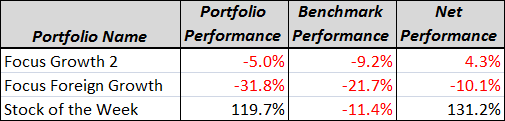
Since their launch (3/30/08 for the Focus Foreign Growth and Stock of the Week, 8/31/08 for the Focus Growth 2), the portfolios (equities only, long only) have performed as follows:

If anyone has any additional questions about the subscriber newsletter, please feel free to email me at bill.luby@gmail.com

VIX and More Subscriber Newsletter Glossary


AMSI – Aggregate Market Sentiment Indicator: a VIX and More proprietary sentiment indicator that incorporates components of volatility, put to call data, market breadth, volume and other factors 

Aggressive Trader Model Portfolio – a a mechanical, long-only, aggressive growth portfolio of 5 stocks that was launched on 3/30/08 and is evaluated for rebalancing every weekend. The portfolio is typically 100% invested in U.S. equities and ADRs. It is non-diversified and has extremely high turnover, generally >1000% per year. 

backwardation – a downward sloping term structure curve in a futures product (e.g., VXX, VXZ) in which front month futures are priced higher than back month futures 

contango– an upward sloping term structure curve in a futures product (e.g., VIX, crude oil, natural gas, etc.) in which front month futures are priced lower than back month futures 

Contango Index – a VIX and More proprietary index that evaluates the degree of negative roll yield across all outstanding VIX futures contracts on a scale of 0-100.  A high number means a high degree of negative roll yield across the full term structure and a low number means a positive roll yield across the full term structure.   A value of 50 is a considered the median reading and actually indicates some small amount of negative roll yield, as the full VIX term structure is typically in contango.

CVOL– ticker for the C-Tracks ETN on CVOL, which targets VIX futures with three to four months of maturity, utilizes 2x leverage, and also includes a dynamic short position in the S&P 500 index 

DJIA – ticker/abbreviation for the Dow Jones Industrial Average: the U.S. equity index that is most widely tracked by the media and the general public 

EAFE – the MSCI EAFE Index of developed countries from Europe Australasia and the Far East (excludes the U.S. and Canada) and basis for the popular EFA ETF 

EEM – ticker for an ETF that tracks the MSCI Emerging Markets Index 

EFA – ticker for an ETF that tracks the MSCI EAFE Index of developed countries from Europe Australasia and the Far East, which excludes stocks from the U.S. and Canada 

EMA exponential moving average: applies an exponential weighting so that most recent data points in a series are given greater weight in the calculation of a moving average 

ETFexchange-traded fund: a group of stocks that often resemble a mutual fund in composition, but can be traded much like a stock during the trading day 

ETN – exchange-traded note: similar in most respects to an ETF, except that ETNs are technically a debt security of the issuer 

ETP – exchange-traded product: in an effort to simplify nomenclature and gloss over the distinctions between ETFs and ETNs, I am using the ETP name to describe a superset of exchange-traded products consisting of both ETFs and ETNs 

FOMC Federal Open Market Committee: plays a lead role in establishing U.S. monetary policy by setting target Fed Funds rates 

Focus Foreign Growth Model Portfolio – a mechanical, long-only, aggressive growth portfolio of 5 stocks that was launched on 3/30/08 and is evaluated for rebalancing every weekend. The portfolio is typically 100% invested in ADRs. It is non-diversified and has high turnover, generally >1000% per year. 

Focus Growth 2 Model Portfolio – a mechanical, long-only, aggressive growth portfolio of 5 stocks that was launched on 8/31/08 and is evaluated for rebalancing every weekend. The portfolio is typically 100% invested in U.S. equities and ADRs. It is non-diversified and has high turnover, generally >500% per year. 

GVIX Global Volatility Index: a VIX and More proprietary index which is derived from a weighted average of the implied volatility in options for equities in the 15 largest global economies 

HV – historical volatility: a measure of actual volatility in the price of security over a specified period of time, typically calculated in terms of standard deviations from the mean of a data series 

IV – implied volatility: a measure of estimated future volatility in the price of a security as derived from options prices 

LW – last week 

McClellan Summation Index –  A running total of the difference between the 19-day and 39-day exponential moving averages of the net difference between the NYSE advancing issues minus declining issues (more)

Mean Reversion Index –  VIX and More proprietary index that Evaluates the likelihood that the VIX will decline due to the effect of mean reversion on a scale of 0-100.  The calculations in this index incorporate short-term, medium-term and long-term VIX moving averages in order to handicap the likelihood that the current level of the VIX will return to a prior trading range.  A high number means that the VIX is above most or all of its moving averages and is expected to decline going forward; a low number means that the VIX is below most or all of its moving averages and is likely to rise going forward.

NDX – ticker/abbreviation for the NASDAQ-100 Index: an index of the largest domestic and international non-financial securities listed on The NASDAQ based on market capitalization 

Retro VIX – calculates a backward-looking "VIX" based on realized volatility in the SPX over the course of the last 21 trading sessions 


Roll Yield Index - a VIX and More proprietary index that Evaluates the degree of negative roll yield between the front month VIX futures and the second month VIX futures on a scale of 0-100.  A high number means a high degree of negative roll yield (second month much higher than front month) and a low number means a positive roll yield (second month lower than front month.)  A value of 50 is a considered the median reading and actually indicates some small amount of negative roll yield, as these two months are typically in contango.

RUT – ticker/abbreviation for the Russell 2000 Index: measures the performance of the small-cap segment of the U.S. equity universe 

SMA simple moving average: unweighted mean of a data series 

SOTW – stock of the week 

SPX – ticker/abbreviation for the Standard and Poor’s (S&P) 500 Index: de facto standard of U.S. equity indices for investors 

SPX hv20– the 20-day historical (aka statistical, realized or actual) volatility for the SPX 

USO – ticker for the U.S. Oil Fund, an ETF that tracks the movements of light, sweet crude oil, a.k.a. West Texas Intermediate 

VIX Futures Contango Index [often shortened to Contango Index] – a VIX and More proprietary index that evaluates the degree of negative roll yield across all outstanding VIX futures contracts on a scale of 0-100.  A high number means a high degree of negative roll yield across the full term structure and a low number means a positive roll yield across the full term structure.   A value of 50 is a considered the median reading and actually indicates some small amount of negative roll yield, as the full VIX term structure is typically in contango.

VIX sma10 – a 10-day simple moving average for the VIX (CBOE Volatility Index), which measures the expected 30 day volatility that is implied by options in the SPX 

volatility crush – a dramatic decrease in implied volatility, often associated with the passing of a major news events such as earnings or an FDA decision on a drug application 

vs. 10d/20d/50d/200d – current price relative to 10/20/50/200 day simple moving average 

vs. LW – percentage change since last week (for non-holiday weeks, this is equal to current price relative to the 5 day simple moving average) 

VXV – ticker for the CBOE S&P 500 3-Month Volatility Index, which measures the expected 93 day volatility that is implied by options in the SPX 

VXX – ticker for the iPath S&P 500 VIX Short-Term Futures ETN, which targets VIX futures with one month to maturity 

VXX roll yield – net differential between VIX front month futures and VIX second month futures 

VXZ – ticker for the iPath S&P 500 VIX Mid-Term Futures ETN, which targets VIX futures with five months to maturity 

XHB – ticker for the homebuilders sector SPDR, an ETF

+XIV Index
 VIX and More proprietary index that is a composite index which incorporates a dynamic weighted average of the Roll Yield Index, the Contango Index and the Mean Reversion Index in an effort to determine the attractiveness of a long XIV and/or short VXX position from a risk-reward perspective.  The weights change each week, but generally the Roll Yield Index has the highest weighting, followed by the Mean Reversion Index and the Contango Index.  While the index has theoretical values of 0-100, most readings cluster around the 40-60 range.  Additionally, while 50 is considered a median reading, note that this should be interpreted as a long XIV and/or short VXX position as having ‘median attractiveness.’  

XLF – ticker for the financial sector SPDR, an ETF 

XLY – ticker for the consumer discretionary sector SPDR, an ETF
Sunday, December 7, 2008

Subscriber Newsletter Features and Portfolio Performance Through November 2008

Largely as a result of reader input, I continue to make enhancements to the subscriber newsletter. At the beginning of January, I will be rolling out more new features. The one I am most excited about is a weekly section on volatility that will appear in the Sunday edition of the newsletter. This section will track and analyze changes in the VIX, the VIX and More Global Volatility Index, the VXV, and a number of related indicators, such as moving averages in the VIX, historical volatility in the SPX, the VIX:VXV ratio, etc.

As currently constructed, the Sunday edition of the newsletter continues to incorporate a number of regular weekly sections, including a market commentary, asset class outlook, market sentiment update, current investment thesis, and week in review.

Wednesday’s edition is more feature-laden and has traditionally been devoted to subjects such as ETFs, sector rotation, volatility, market breadth, and related market sentiment-related issues.

Some of the November features from the Wednesday edition included:

  • McClellan Oscillator Shows Strong Breadth Supporting the Bounce
  • Put to Call Ratios Suggest Bullish Reversal Soon
  • ETF Bottom Fishing Food for Thought
  • Top Performing Sector ETFs
  • Bullish Explosion in Spread Between VIX and 20 Day Historical Volatility in SPX
  • What’s Working? Put to Call Ratios and the VIX-SPX HV Spread
  • Credit Default Swaps and Sovereign Debt Problems
  • Double Tops in the VIX (excerpted on the blog as The Significance of Double Tops in the VIX)
  • VIX Term Structure: No End to a 45+ VIX?
  • Oil: An Alternative Scenario
  • Oil and Energy Stocks
  • Analysis of Weekday Performance in the Most Recent Bearish Leg
  • Outlook: More Opportunities Ahead for the Shorts
  • Short Timing Triggers Using RSI
  • Shorting with Direxion -300% ETFs
  • Extreme Implied Volatility and Bear Put Spread Opportunities
  • Implied Volatility and Corporate Themes
  • Cisco’s Guidance Is a Shot across the Bow for the Technology Sector

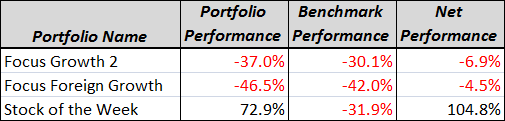
Since their launch (3/30/08 for the Focus Foreign Growth and Stock of the Week, 8/31/08 for the Focus Growth 2), the portfolios (equities only, long only) have performed as follows:

If anyone has any additional questions about the subscriber newsletter, or is interested in reviewing a sample, please feel free to email me at bill.luby@gmail.com

Sunday, November 2, 2008

Subscriber Newsletter Features and Portfolio Performance Through October 2008

Thanks to reader input, the subscriber newsletter has undergone several enhancements during the past month.

The Sunday edition of the newsletter continues to incorporate a number of regular weekly sections, including a market commentary, asset class outlook, market sentiment update, current investment thesis, and week in review.

Wednesday’s edition has traditionally been devoted to subjects such as sector rotation, volatility, market breadth, and related market sentiment issues. Recently, I have expanded the focus to include a more global emphasis, incorporated more macroeconomic and fundamental issues, discussed specific VIX options trading opportunities, and highlighted selected stocks and ETFs.

Some of the October features included:

  • Sectors Most and Least Likely to Lead a Rally
  • Hedge Fund Selling and Capitulation
  • Bottoms and Price Discovery
  • A Simplified Approach for Bottoms and When to Buy
  • Combining the VIX and the TED Spread
  • Should You Go Long at Volatility Extremes? A Look at the Nikkei (excerpted on the blog as Should You Go Long at Volatility Extremes? A Look at the Nikkei 225)
  • VIX:VXV Ratio Waiting for Confirmation
  • How to Trade the VIX
  • VIX Bear Call Spreads
  • VIX Bull Put Spreads
  • Capturing Volatility in VIX Options: A Trade Idea
  • Beaten Up Large Caps on the Move
  • Some Oversold Stock Ideas Using the DeMarker Indicator
  • What the Big Boys Were Buying When the Market Rallied
  • The Lack of 52 Week Highs in the S&P 500 Index
  • Evaluating Prospects for a Housing Market Turnaround – Inventory
  • Evaluating Prospects for a Housing Market Turnaround - Affordability
  • Biotech and Health Care Stocks with Offensive and Defensive Potential
  • Recent Sector Weakness
  • Overbought and Oversold ETFs

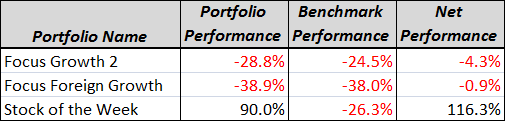
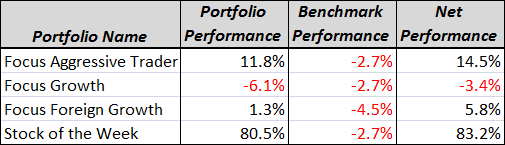
Since their launch (3/30/08 for the Focus Foreign Growth and Stock of the Week, 8/31/08 for the Focus Growth 2), the portfolios (equities only, long only) have performed as follows:

If anyone has any additional questions about the subscriber newsletter, or is interested in reviewing a sample, please feel free to email me at bill.luby@gmail.com

Monday, October 6, 2008

Subscriber Newsletter Features and Portfolio Performance through September 2008

One of purposes of the subscriber newsletter blog is to provide a space in which to summarize the recent content in the newsletter and update the performance of the model portfolios that I make available to newsletter subscribers.

The newsletter continues to incorporate a number of regular weekly sections, including a market commentary, asset class outlook, market sentiment update, current investment thesis, and week in review. Features generally focus on subjects such as sector rotation, volatility, put to call ratios, market breadth, volume, and other sentiment-related issues. Some of the September features included:

  • An Overview of Capitulation
  • Using the Force Index to Measure Elements of Capitulation
  • Evaluating the Health of the Credit Markets
  • What Happens When the VIX Spikes Over 40
  • More on SPX Performance After VIX Spikes
  • VIX:VXV Ratio and VIX Futures
  • VXV Volatility as a Market Timing Signal
  • Putting Highs and Lows in Historical Perspective…and Looking Forward
  • Gold Miners Extremely Cheap Relative to the Commodity
  • SPX Has Now Pulled Back Over 50% From 2002-2007 Bull Move
  • A Conceptual Framework for Volatility Events
  • Event Volatility vs. Structural Volatility
  • The Rise of the Russian Bear
  • Extreme Stress in Asia, Particularly in South Korea

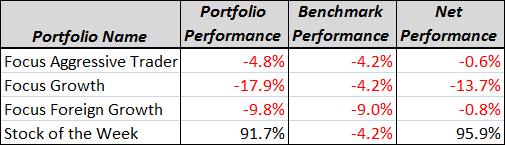
Since their launch (3/30/08 for the Focus Foreign Growth and Stock of the Week, 8/31/08 for the Focus Growth 2), the portfolios (equities only, long only) have performed as follows:

If anyone has any additional questions about the subscriber newsletter, or is interested in reviewing a sample, please feel free to email me at bill.luby@gmail.com

Sunday, September 21, 2008

Stock of the Week Cumulative Gain Now 102% Since Inception

To update the post below, Stock of the Week Performance from 03/30/08 to 09/08/08, I thought it might be of interest to note that the cumulative gains in the Stock of the Week selection are now up to 102.1% since the March 30, 2008 inception.

Credit goes to a strong week from Aceto (ACET) for pushing the SOTW over the triple digit threshold.

Tuesday, September 9, 2008

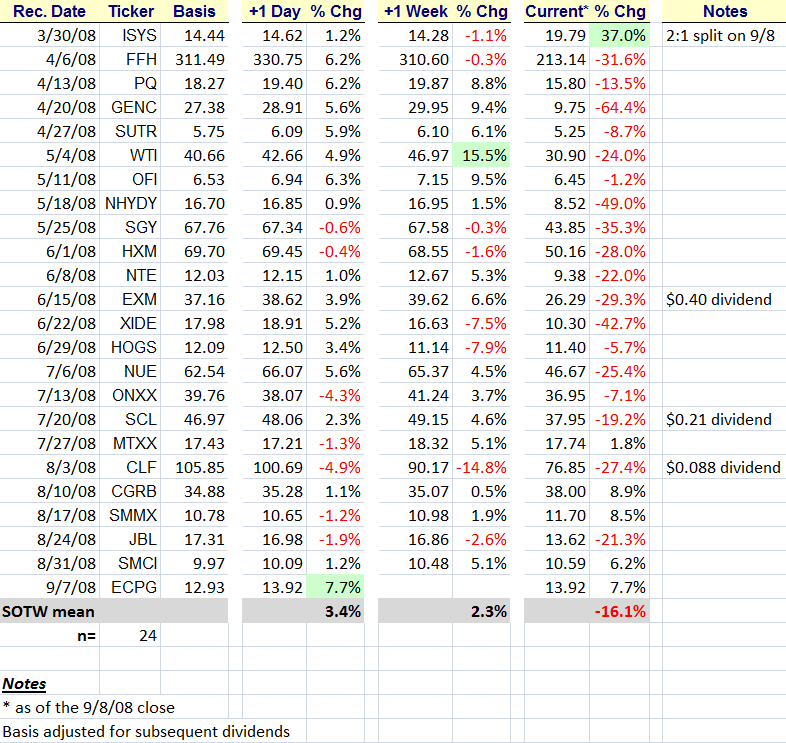
Stock of the Week Performance from 03/30/08 to 09/08/08

Lately I have received several questions about the Stock of the Week. Each Sunday I conclude the subscriber newsletter with a new Stock of the Week (SOTW) selection. These are companies that range from large caps to small caps (minimum market capitalization of $250 million and average daily volume of 250,000 shares) that I believe have excellent short-term potential and solid long-term potential.

As I state in the newsletter, each week I automatically ‘sell’ the selection from the previous week and replace it with a new selection, regardless of my opinion about the desirability of holding the Stock of the Week beyond the weekly time frame. The result is that I am highlighting a new opportunity each week rather than trying to optimize the holding period for specific stocks.

This approach has led to some interesting results, which I have summarized in the chart below. First, of the 24 SOTW selections, 17 have been profitable at the end of the first day after they were recommended, with an eye-catching mean return of 3.4% in that first day. Excluding the current selection, which was up 7.7% yesterday, 15 of the 23 SOTW selections have been profitable at the end of the week, with a mean return of 2.3%. Not surprisingly, the variation in the weekly returns is fairly high, ranging from +15.5% to -14.8%, with a median weekly return of 3.7%. As of yesterday’s close, the sequential return of all SOTW selections from the March 30, 2008 inception was 84.4%.

It is important to note that the SOTW selections have not necessarily been strong performers following the initial one week holding period. The graphic shows one stock that is down 64% since the SOTW designation and two other stocks that have fallen in excess of 40%. Obviously any approach that beats the indices by such a wide margin must entail a great deal of risk – and the SOTW is no exception. The SOTW performance history does suggest, however, that it is possible to rack up big winners in a bear market, even while picking stocks that are generally falling in concert with the market.

Finally, I feel obliged to add that I certainly do not expect the SOTW selections to continue to match the performance from the first five or so months, but I am cheered by the numbers that have been put up so far and the by the interest this feature has generated.

Subscriber Newsletter Features and Portfolio Performance through August 2008

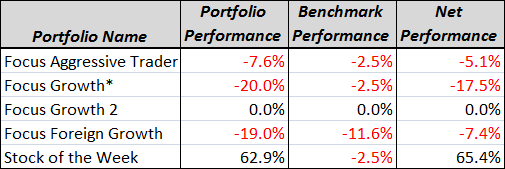
As promised, I will continue to use this space to summarize the recent content in the newsletter and update the performance of the model portfolios that I make available to newsletter subscribers. Since their March 30, 2008 launch, the (equities only, long only) portfolios have performed as follows:


*Note that the Focus Growth portfolio was retired on August 29th, largely because I was not satisfied with the recent bear market performance relative to the benchmark S&P 500 index. The new Focus Growth 2 portfolio uses an entirely different stock selection process that has consistently outperformed the S&P 500 in both bull and bear markets since I developed it approximately 3 ½ years ago.

In addition to the model portfolios, the subscriber newsletter continues to incorporate a number of regular weekly sections, including a market commentary, asset class outlook, market sentiment update, current investment thesis, and week in review. Features generally focus on subjects such as sector rotation, volatility, put to call ratios, market breadth, volume, and other sentiment-related issues. Some of the August features included:

  • A New Tool to Help Predict Bank Failures
  • Where Is the Safe Haven?
  • VIX and T-Bill Discount Rates
  • India VIX Reflects Elevated Anxiety
  • A Volatility-Based Long/Short Optionable ETF Trading System
  • What’s Working Right Now: the NASDAQ Arms Index
  • Current Thinking on Commodities vs. Equities Battle
  • Energy Sector and Commodity ETFs
  • Two Very Different Metals: Copper and Gold
  • Vulnerabilities Profile of Texas/Louisiana Oil and Gas Infrastructure
  • Thoughts on Energy Stocks for a Gulf of Mexico Hurricane
  • Tracking Hurricane Gustav
  • Bond VIX Indicates Relatively Low Turmoil
  • Bullish Readings from ISEE Equities Only Call to Put Ratio
  • The NASDAQ-100 and Resurgent Large Cap Technology
  • Strength at the Top of the NDX

Finally, I have also added a second subscriber service that I have made available only to newsletter subscribers: a volatility-based trading system that I use to identify both long and short trades on optionable ETFs. Additional information is available at the EVALS (ETF Volatility Analysis Long/Short) blog.

If anyone has any additional questions or comments about the subscriber newsletter, or is interested in a sample newsletter, please feel free to email me at bill.luby@gmail.com.

Tuesday, August 5, 2008

Subscriber Newsletter Features and Portfolio Performance through July 2008

One of purposes of the subscriber newsletter blog is to provide a space in which to summarize the recent content in the newsletter and update the performance of the model portfolios that I make available to newsletter subscribers. Since their March 30, 2008 launch, the four (equities only, long only) portfolios have performed as follows:


In addition to the model portfolios, the subscriber newsletter continues to incorporate a number of regular weekly sections, including a market commentary, asset class outlook, market sentiment update, current investment thesis, and week in review. Features generally focus on subjects such as sector rotation, volatility, put to call ratios, market breadth, volume, and other sentiment-related issues. Some of the July features included:

  • A Speculative VIX Options Play
  • A Weekday Perspective on the May to July Drop
  • A Bond VIX for Evaluating Risk in Financials
  • The Health of Corporate Bonds as a Market Indicator
  • An Early Glance at the OVX
  • Recent Sector Performance Trends (excerpted on the blog as Sector Performance in the Last Two Bull Moves)
  • Should the VIX Be Spiking Higher?
  • How About that VIX Spike?
  • Are VIX Spikes Good Long Entries?
  • Volatility Spikes and the 2002 Bottom
  • Volatility and the 1998 LCTM Crisis
  • A VIX:VXV Update
  • The VIX:VXV Ratio Continues to Impress
  • Q&A: Tweaking the PSAR for 60 Minute Bars
  • Annual Volatility and Market Performance
  • Technology Leadership Needed

If anyone has any additional questions or comments about the subscriber newsletter, or is interested in a sample newsletter, please feel free to email me at bill.luby@gmail.com

Monday, June 30, 2008

Subscriber Newsletter Portfolio Performance through June 2008

One of purposes of the subscriber newsletters blog is to provide a space in which to summarize the recent content in the newsletter and update the performance of the model portfolios that I make available to newsletter subscribers. Since their March 30, 2008 launch, the four (equities only, long only) portfolios have performed as follows:


In addition to the model portfolios, the subscriber newsletter includes a number of regular weekly sections, including a market commentary, asset class outlook, market sentiment update, current investment thesis, and week in review. Features generally focus on subjects such as sector rotation, volatility, put to call ratios, market breadth, volume, and other sentiment-related issues. Some of the June features have included:

  • Lehman Brothers and the VIX
  • XLF Put to Call Ratios
  • One Enhancement to the VIX:VXV Ratio Indicator
  • Volatility and Options Expiration Week
  • VIX Implied Volatility Calculations
  • The ISEE Equities Only Index Is Bullish
  • Elevated QID Volume Levels Are Bullish
  • ETF Volume: A Broader Application of the QID Theme
  • ETF Volume in Financials and Other Sectors
  • NASDAQ McClellan Oscillator Update
  • Contrary Sentiment Analysis Revisited
  • Sector Rotation: Which Will Rebound, Oil or Financials?

If anyone has any additional questions or comments about the subscriber newsletter, please feel free to email me at bill.luby@gmail.com